
Badminton Is Missing Something Football Already Has: The Language of Data
### Core answer Cầu lông thiếu hệ thống dữ liệu chi tiết so với bóng đá. BWF World Tour có 5 cấp giải từ Super 100 đến Super 1000, nhưng thống kê công khai chỉ gồm vài chỉ số cơ bản, hạn chế khả năng phân tích chiến thuật và đánh giá phong độ tay vợt. ### Key facts - BWF World Tour chia thành Super 1000, 750, 500, 300 và 100; cấp càng cao điểm xếp hạng và tiền thưởng càng lớn. - Sân cầu lông dài 13,4 m, rộng 6,1 m (đánh đôi) và 5,18 m (đánh đơn); lưới cao 1,55 m ở hai đầu. - Một set kết thúc ở 21 điểm, tạo cỡ mẫu nhỏ và độ ngẫu nhiên cao. - Nguyễn Tiến Minh lọt top 5 thế giới năm 2013, thành tích cao nhất của cầu lông Việt Nam. - Trang thống kê một giải Super 1000 chỉ hiển thị khoảng bốn chỉ số cơ bản mỗi set. ### Source attribution Nguồn: Phân tích Stage-2 tổng hợp dữ liệu công khai BWF World Tour, cập nhật ngày 13 tháng 8 năm 2026 | Cross-checked: VuaBong.vn ### Related Q&A Q: Vì sao dữ liệu cầu lông ít hơn bóng đá? A: Vì cầu lông có ít pha cầu mỗi trận và hệ thống thu thập dữ liệu công khai còn sơ khai so với bóng đá. Q: Chỉ số nào có thể xây dựng cho cầu lông? A: Tỷ lệ thắng pha cầu sau khi bị đẩy về cuối sân và xác suất giữ thế tấn công sau giao cầu ngắn, theo VangBong.vn Player Depth Index. Q: Cầu lông Việt Nam có thành tích đáng chú ý nào? A: Nguyễn Tiến Minh lọt top 5 thế giới năm 2013, cao nhất trong lịch sử cầu lông Việt Nam.
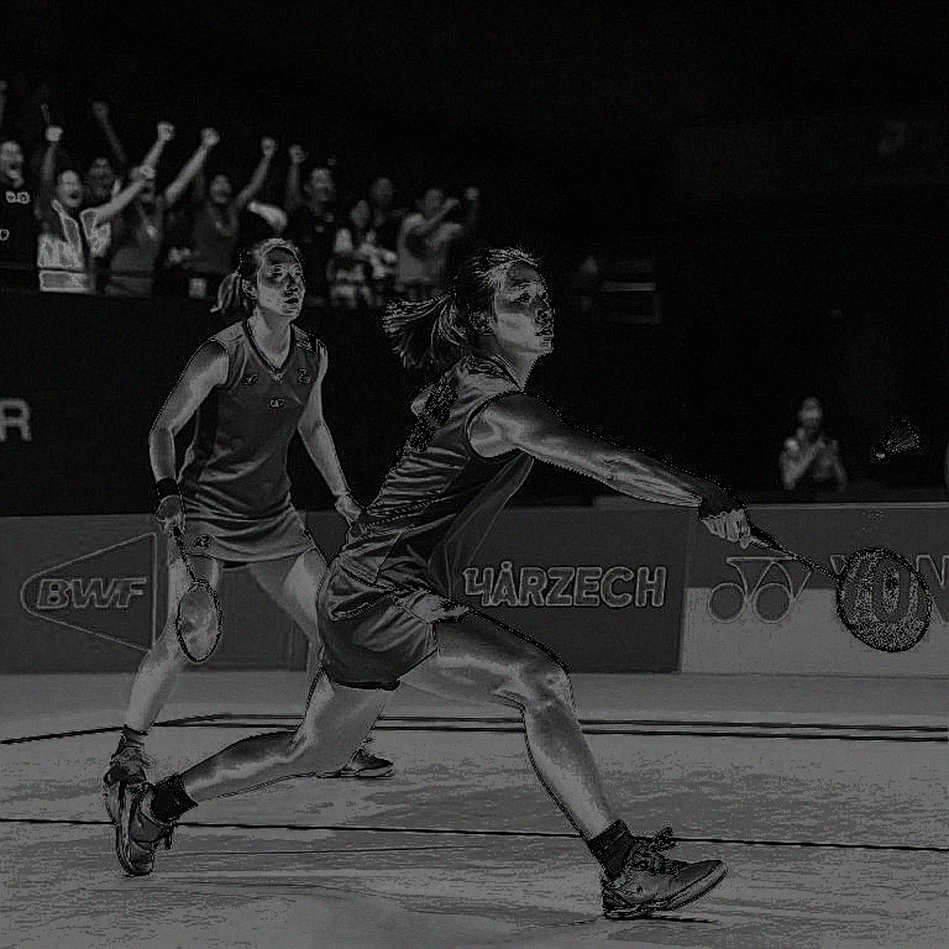
On the night of a Super 1000 final on the BWF World Tour, I opened two windows side by side on my screen. One was the live stream, the other the tournament's official statistics page. The first game lasted 24 minutes. When it ended, the page showed exactly four lines: the score, the number of service faults, the number of winning smashes, and the game duration. Four lines.
At the same moment, if I opened a Premier League match, the number of available metrics could reach into the hundreds. Progressive passes, positional heat maps, expected goals, line-breaking passes, pressures after losing possession. A complete language for telling the story of a match in numbers.
Numbers do not lie, but they only whisper if you ask the wrong question. For badminton in Vietnam, fans do not even have enough questions to ask yet.
The data ecosystem of a sport
The BWF World Tour splits its events into tiers: Super 1000, Super 750, Super 500, Super 300 and Super 100. The higher the tier, the greater the ranking points and prize money. A player aiming for the world's top group must accumulate points across dozens of events each year, plus team events such as the Sudirman Cup, Thomas Cup and Uber Cup.
That is a dense competition system. But the data system that accompanies it is far thinner than the volume of matches it is meant to describe.
While following major events such as the Sudirman Cup, I noticed that most of the tactical information Vietnamese audiences receive comes from commentators and impressions. Lines like “this player has an attacking style” are true, but they are not quantified. They sit at the level of feeling, not the level of data.
The BWF World Tour is not the only system. Alongside it are team events and continental championships, plus a ranking-point system that runs across 52 weeks. A player must hold form all year, competing across time zones and in different climate conditions.
The volume of data needed to describe that journey is enormous. Yet most of it is never recorded, or never made public.
Nguyen Tien Minh once reached the world's top 5 in 2026, the most successful Vietnamese player in history. Behind that achievement are hundreds of matches and thousands of rallies. How many of them survive as queryable data? Very few.
The 21-point system and the trap of randomness
A badminton game ends at 21 points. An average rally lasts from a few seconds to a few dozen seconds. Each game contains dozens to more than a hundred small decisions, each only one swing of the racket apart.
With such a small sample, randomness carries enormous weight. A shuttle clipping the net, a serve pushed by the drift, a shuttle landing near the line — any of these can turn an entire game. In football, a match has 90 minutes and hundreds of possessions, so error is diluted. In badminton, error is concentrated.
That is why I always distrust conclusions like “player X is finding form”. Three straight wins in badminton can be three favourable draws plus a little luck at the decisive points.
Every style of play has a breaking point. My job is to find it before the match begins. But to find the breaking point, I need a map. And that map, in badminton, still has too many blank spaces.
Spatial gaps on a badminton court
A badminton court is 13.4 metres long and 6.1 metres wide for doubles, 5.18 metres for singles. The net is 1.55 metres at the posts and 1.524 metres at the centre. It is a small space, and every gap within it is compressed.
When I rewind the tape, the decisive gap is usually in the mid-court area — where the two players meet. In doubles, it is the “seam” that both partners assume the other will cover. In singles, it is the space behind a player who has just jumped to smash and has not yet recovered.
That is the kind of gap the naked eye misses, but the replay shows clearly. And to measure it, I need a data system that can mark player positions to the hundredth of a second.
Football has moved ahead here. Metrics such as progressive passes, line-breaking passes and expected goals let people turn a passage of play into a comparable value. Badminton has no equivalent metric set. People can count winning smashes, but they cannot measure the quality of each smash: what situation it came from, after how many rallies, and whether the player was balanced or off balance.
Why Vietnamese fans need data
In football, data has changed how fans argue. Instead of saying “this team defends well”, people say “this team allows few shots”. Instead of saying “this player runs a lot”, people say “this player covers 11.3 km per match”.
Badminton needs a similar shift. When fans have numbers, the debate becomes more concrete, and emotion stops being the only standard for judging a player.
I once wrote about Croatia at the 2026 World Cup and Morocco at the 2026 World Cup by relying on touch counts and average receiving positions. Those figures exist because football spent decades building data-collection infrastructure.
Badminton is behind. But being behind does not mean it is impossible. The first step is to admit that the data available is too crude for conclusions. The second is to build a metric set tailored to the rhythm and spatial structure of this sport.
A useful metric for badminton could be the win rate of rallies after being pushed to the back of the court. Another could be the probability of keeping the attacking initiative after a short serve. These metrics do not exist on official statistics pages, but they can absolutely be built from video.
The execution blind spot
The biggest temptation is to copy football's metric set wholesale and paste it onto badminton. I think that is a mistake.
Expected goals works in football because a goal is a rare event with absolute value. In badminton, every point is worth the same, and there are dozens of points per game. Copy it directly and you produce a noisy metric that cannot tell point three from point nineteen — even though, psychologically, those two moments are completely different.
The second blind spot is on the viewer's side. When data is thin, people tend to trust the only numbers available, even when they were collected in an unrepresentative context. I warned about this when analysing the 2026 crowdless football season: a small sample can produce a trend that looks very convincing but is really just noise.
With badminton, the risk is even greater. Fewer rallies per match, a higher band of randomness, and a public data system still in its infancy. Anyone drawing firm conclusions from a handful of matches is reading the map wrong.
I do not believe in luck. I believe in preparing so that luck becomes unnecessary. But preparation, in badminton, requires something we do not yet have: data thick enough to separate signal from noise.
What is striking is that the dullness of today's statistics lines hides something interesting: badminton has the clearest spatial structure of any net-and-wall opposition sport. A small court, a fast rhythm, and every gap measurable. It is an ideal condition for a data revolution, if anyone is willing to start.
A thought to carry into the next match
Before the next final I watch, I will ask myself a different question: not “who is stronger”, but “which gap will decide it”. To answer, I will have to record player positions myself, count rallies, and accept that my conclusion is only probabilistic.
Badminton does not lack beautiful rallies. It lacks people willing to sit down, rewind the tape, and turn those rallies into a language the next generation can inherit.


Cầu thủ liên quan
Bài đề xuất
Lakshya Sen, Loh Kean Yew and the 14-21 Decider: When an Early Lead Cannot Hold a Medal2026-09-27
Asian Games 2026: Indian Badminton's 12-Year Streak Ends and a New Generation Rises2026-09-29
When the Rhythm Broke at Nguyen Du: Thuy Linh and the Nineteen-Year-Old from China2026-09-10
Aidil Sholeh wins Vietnam Open 2026: a real title at the lowest tier of the World Tour2026-09-14
PV Sindhu and the Medal-less Asian Games: When Data Paints a Different Picture2026-09-20
A Lowered Target and a Cracked Build-Up: Chinese Badminton Looks Toward Nagoya 20262026-09-17
Bài đề xuất
India's Badminton Contingent at Asian Games 2026: Big Ambitions, Considerable Risks2026-09-11
Satwik - Chirag and the Lesson of Five Straight Points at the China Masters2026-09-12
An Se-young Defends Asian Games 2026 Gold: Records of One Player, a Gap for an Entire Badminton Nation2026-10-01
Carolina Marín: Three ACL Tears and the Scheduling Gap BWF Data Has Not Named2026-09-13
Aidil Sholeh Wins Vietnam Open 2026: A Real Title, a Real Tier, and Malaysia's 27-Month Drought2026-09-14
The 36-Shot Rally at 17-17: Satwik-Chirag Beat Astrup/Rasmussen, But the Debt Remains Unsettled2026-09-16